At work we recently had a need to monitor various internal servers and I was trying to avoid going down the ‘We can use Zabbix!’ route as it seems like Prometheus is becoming a standard of sorts. It is pretty simple to setup and easy to manage via config files etc… if a little peculiar at first. But, you have the problem of having to go in and register each VM as a target in prometheus etc etc… and Consul seemed like a nice way to avoid that part. So, I thought I would write down the simplest route to getting to a point where everything works and we can inspect the results in a nice simple system which monitors whatever we need.
I did originally try and use Docker and Docker-Compose to set this up but it was actually easier to just use an Ubuntu 20.04 server and install things natively as it avoided weird issues with networks. Everything should be applicable to Docker though, but to keep things simple we will just go (virtual) bare metal. We will then get a Windows machine and install the Windows Exporter, install a consul agent with some labels, and then we should be good. Have more systems to monitor? Just repeat that process ad-infinitum and things will self-monitor, magic!
NOTE If you want some really good detail on everything prometheus/alertmanager and what to do to get it going, I can highly recommend this book https://www.prometheusbook.com.
Installing the services
We will use an Ubuntu 20.04 server edition Linux VM as our host to get our stack running very quickly. None of this is very ‘production’ for fault tolerance but it is a simple setup.
Ubuntu Server VM
Install a fresh Ubuntu 20.04 Server VM (2 CPUs, 8GB RAM and 64GB Disk will be more than plenty for testing) and don’t install any pre-configured system snaps (even though prometheus is there already).
Take a note of the machines IP address as you will need this later (run ip address at the terminal and look for adaptor etho or enp1s0). My examples will use 192.168.1.18 but yours will almost certainly be different so replace it as we go.
Prometheus Install
First, lets make sure we are all up to date
sudo apt-get update && sudo apt-get upgrade -y
Then, lets install prometheus
sudo apt-get install prometheus -y
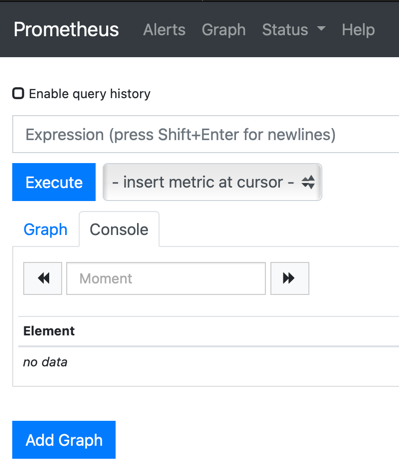
Then, we should have a prometheus dashboard we can inspect: http://192.168.1.18:9090/graph
But, we need to make a few tweaks to the config file at /etc/prometheus/prometheus.yml to do anything really useful, so make a copy in case you want to refer to it later and then amend it with nano.
sudo cp /etc/prometheus/prometheus.yml /etc/prometheus/prometheus-original.yml
sudo nano /etc/prometheus/prometheus.yml
Enter this simple YAML. It says we will do checks (scrapes) on machines every 15 seconds, monitor the server (target) itself, and also our upcoming consul machines (multiple targets).
global:
    scrape_interval: 15s     # By default, scrape targets every 15 seconds.
    evaluation_interval: 15s # Evaluate rules every 15 seconds. The default is every 1 minute.

scrape_configs:
    # Monitor this machine
    - job_name: "prometheus"
      static_configs:
          - targets: ['localhost:9090']
    - job_name: local-node
      # If prometheus-node-exporter is installed, grab stats about the local machine by default.
      static_configs:
        - targets: ['localhost:9100']

    # This is how we tell prometheus to ask the consul service for targets
    - job_name: 'consul-discovery'
      consul_sd_configs:
        - server: 'localhost:8500'
          services: []
      # This essentially says, look for a consul machine with a tag of 'prod' in it, and then monitor it
      relabel_configs:
        - source_labels: [__meta_consul_tags]
          regex: .*,prod,.*
          action: keep
        - source_labels: [__meta_consul_service]
          target_label: job
Done. Restart the service
sudo systemctl restart prometheus
Consul
Then, we install consul as a server using the official repo Hashicorp provide.
curl -fsSL https://apt.releases.hashicorp.com/gpg | sudo apt-key add -
sudo apt-add-repository "deb [arch=amd64] https://apt.releases.hashicorp.com $(lsb_release -cs) main"
sudo apt-get update && sudo apt-get install consul
Then check it is running at: http://192.168.1.18:8500
Consul too needs a config file. So, lets overwrite the original one like below.
sudo nano /etc/consul.d/consul.hcl
Enter this. CHANGE TO YOUR SERVER IP ON THE BOTTOM LINE. It really just says to listen to anyone, run in server mode, and also give us the UI. We have to specify a bind address as we have to tell it which one we use if there are multiple IPV4 addresses on the machine (if you have docker installed for example, this would mess up it being able to guess correctly)
"node_name" = "consul-server"
"server" = true
"ui_config" = {
  "enabled" = true
}
"data_dir" = "/opt/consul"
"addresses" = {
  "http" = "0.0.0.0"
}
"connect" = {
  "enabled" = true
}
"bootstrap_expect" = 1
"bind_addr" = "192.168.1.18"
Then, lets have systemctl start consul for us on boot and also start the service now.
sudo systemctl enable consul
sudo systemctl start consul
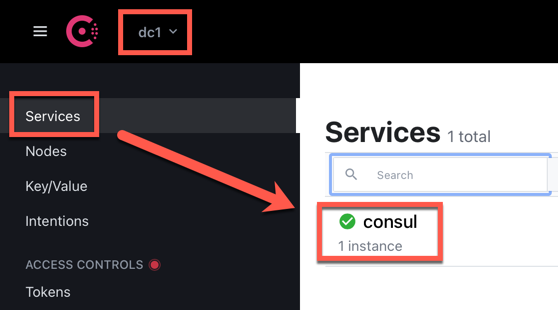
Try going to port 8500 (again, change the IP from my example) and see the Web UI. Note the name is dc1 as this is the default consul server name if one is not supplied.
Prometheus Targets via Consul
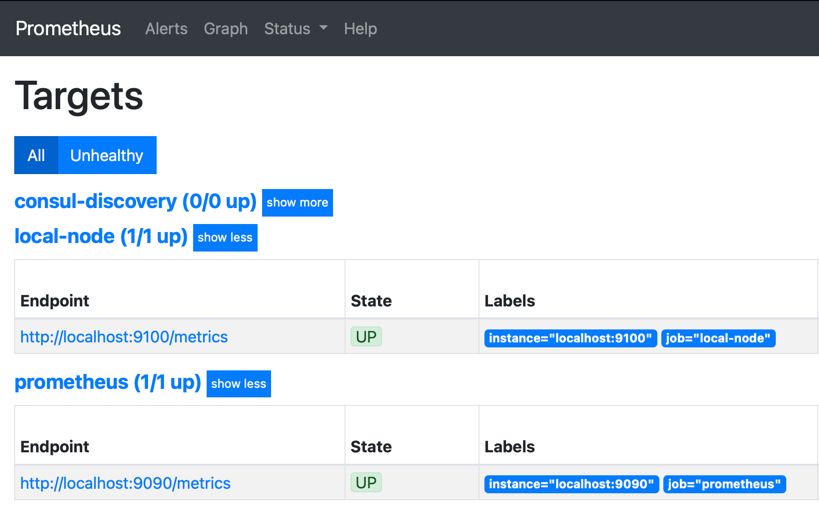
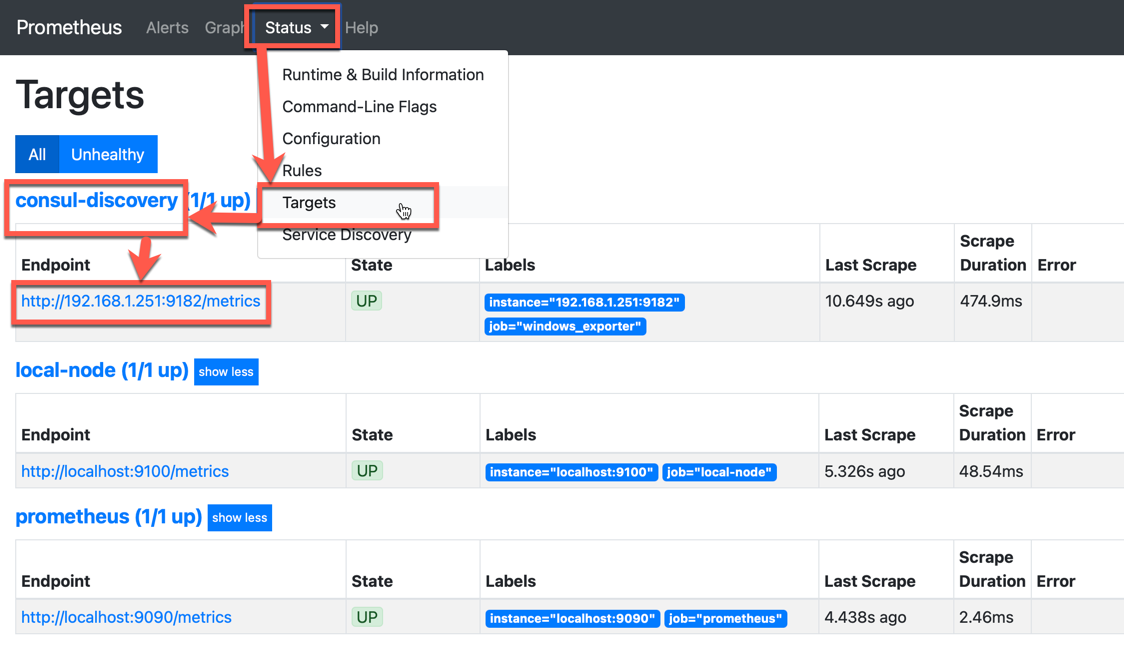
By default, Prometheus only monitors itself. Go to the targets page of your prometheus server, like http://192.168.1.18:9090/targets and you will see just two items, our prometheus app and prometheus server. The consul discovery is empty.
So let’s add a new machine to monitor via Consul.
Windows System Setup
We will use a Windows machine (I still prefer a nice simple GUI) to install Consul and a Prometheus ‘exporter’. The ‘exporter’ presents metrics that Prometheus can ‘scrape’ over a simple web page. In Windows land we use the Windows_Exporter. And, for consul discovery, we install consul on the machine, but in agent mode so that it only joins a cluster, not run one.
By installing both at the same time we can get the metrics system installed and the machine automatically registered in Prometheus without having to amend the prometheus config settings. When you have to do this to hundreds of machines, it is super efficient. Combine it with something like Ansible and you are almost fully automated.
Windows Exporter Install
Install this MSI file from here - https://github.com/prometheus-community/windows_exporter/releases. I would create screenshots but it is honestly just a a Next, Next, Finsh. Once installed, check it is alive and started as a Windows Service called ‘Windows Expoerter’, and by checking via http://your_machines_ip:9182/metrics (ie http://192.168.1.252:9182/metrics). You will see something like this, which is simple data which is scraped by prometheus.
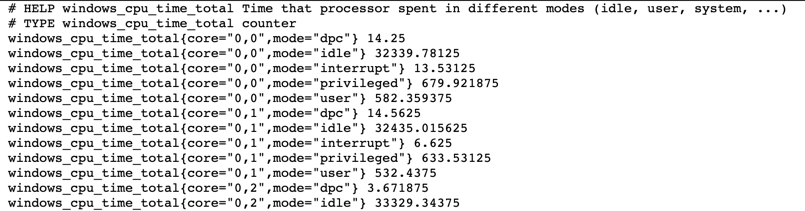
It’s working, now lets install Consul in agent mode so prometheus can know about it.
Consul Install
Grab the latest Windows release from here - https://www.consul.io/downloads
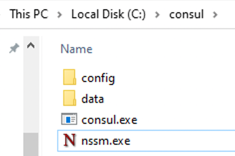
Unzip it to somewhere like c:\consul\consul.exe
We need to create a config file with some required info on where our server is (can consul agents service discover the server? I’d imagine so, i’ll need to look more!). If using ansible you could template this. But, for us, save the below text in a folder called c:\consul\config\ as config.json. Note that the start_join is our Consul server IP address, so adjust as required. The data_dir folder will be created if it doesn’t exist already, so just make it somewhere reasonable.
{
    "server": false,
    "datacenter": "dc1",
    "data_dir": "c:/consul/data",
    "log_level": "INFO",
    "start_join": ["192.168.1.18"]
}
And, we need to give it a couple of ‘labels’ so that when it runs, there is some metadata of sorts for prometheus to latch onto. So, create another file called webserver.json into the same config folder as before. Note prod matches with what we put in the prometheus consul discovery details…
{
  "service":
  {"name": "windows_exporter",
   "tags": ["prod"],
   "port": 9182
  }
}
Then we run this to get it registered in the Consul database. Bind to the machines local IPV4 address and give it a reasonable name (like the machines hostname)
.\consul agent -node=nuc -bind="192.168.1.251" -config-dir="c:/consul/config/" -join "192.168.1.18"
Then run this from our consul server to see if we managed to add it to our list of machines. We have!
.\consul.exe members
Node           Address             Status  Type    Build   Protocol  DC   Segment
consul-server  192.168.1.18:8301   alive   server  1.10.1  2         dc1  <all>
nuc            192.168.1.251:8301  alive   client  1.10.0  2         dc1  <default>
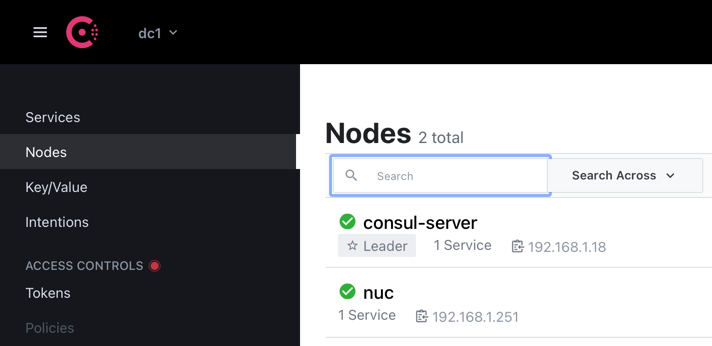
Now, lets check prometheus… We have our node!
Great! Now, after manually checking that the Consul Agent works as hoped, we want to make it into a service so that we don’t have to run it every time the machine boots. So, lets use the “Non-Sucking Service Manager”. Download the exe and place in the c:\Consul folder.
https://nssm.cc/release/nssm-2.24.zip
And then run
nssm install consulagent
Accept any admin prompts and then enter our start command as above but split into the exe file and the arguments, so like this;
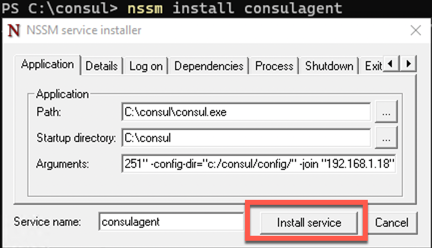
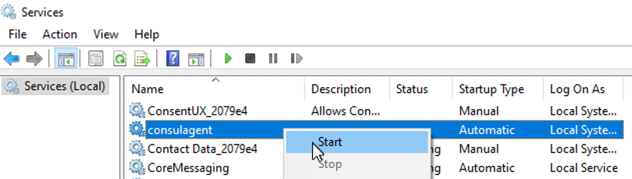
It should now be in services and start and stop with the machine. You will need to start it the first time like so.
Done!
Grafana
We can also install Grafana onto our server. I skipped this for the article as it was getting pretty long, but here are some commands to get you going if you want that too.
sudo snap install grafana
Then check it is running at: http://192.168.1.18:3000
On first login (username admin and password admin) you will be asked to change your password, so update it or simply skip that part.

Install prometheus as a data source and enjoy! Nodes will appear/disappear as they register or leave consul.